Dashboards
In Swit, you can create progress reports using customized charts and graphs that everyone can see, eliminating the need for unnecessary guesswork. Track the time spent on tasks, understand individual workloads, and utilize relevant data to improve project outcomes.
What is a project dashboard?
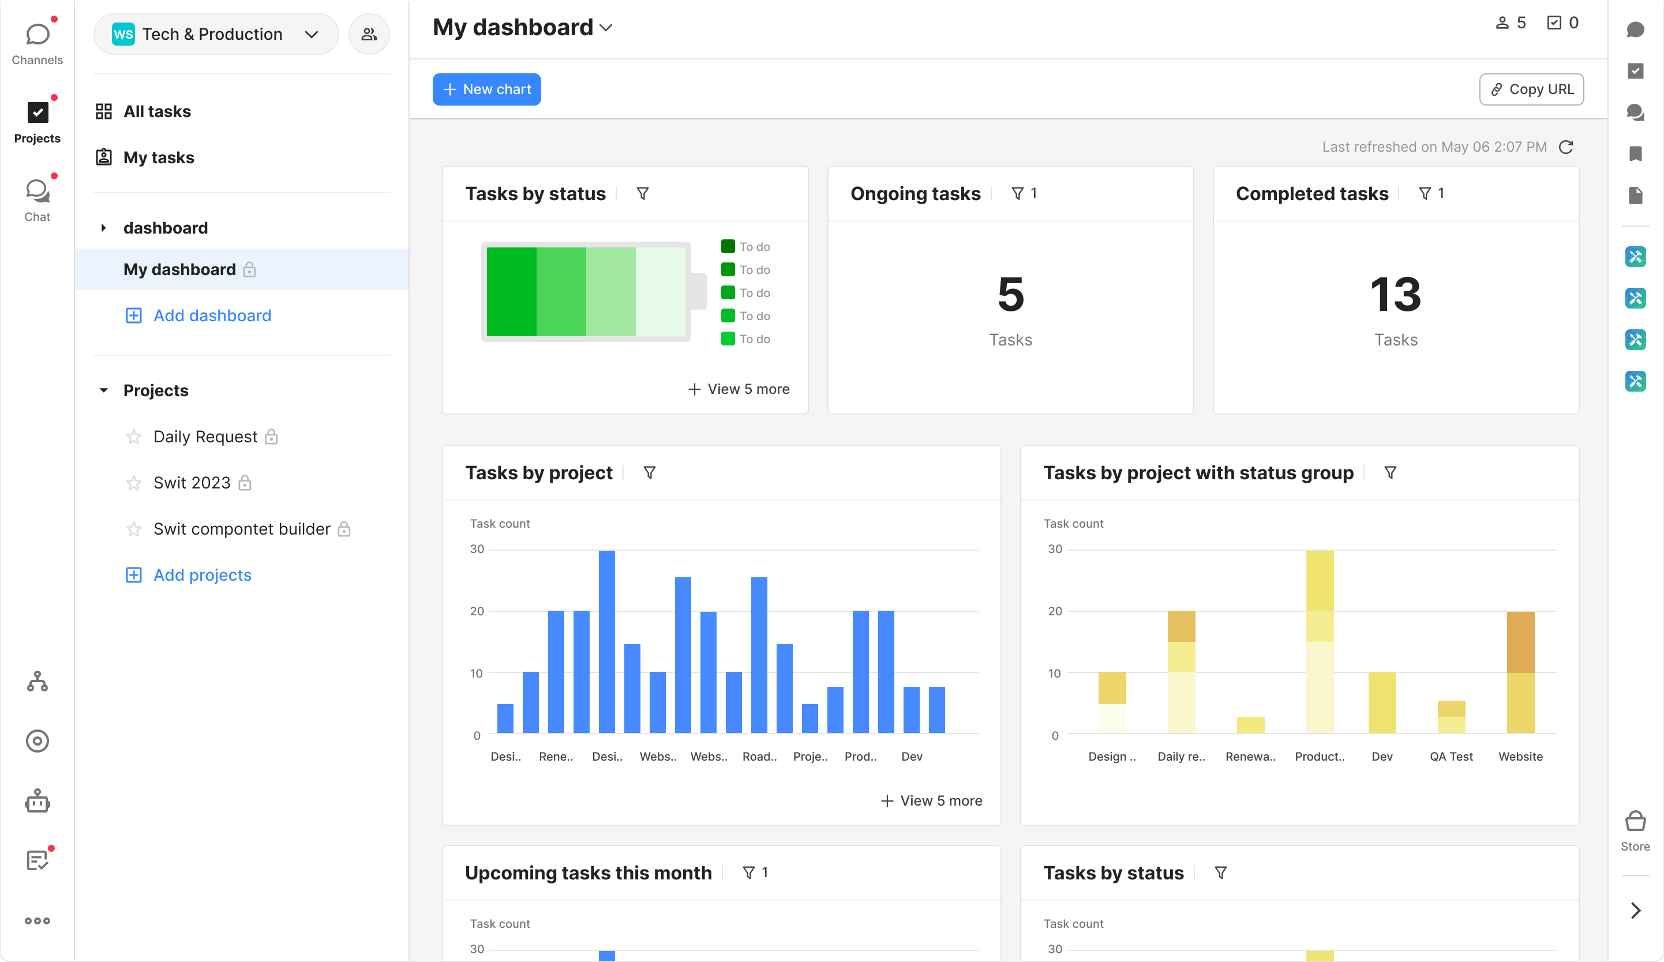
Dashboards help visualize the task data scattered across different projects and view them based on major indicators at a glance. With the dashboards, you can track the progress of related projects or all projects within the organization, and understand their history. You also have the option of a single dashboard view that visualizes tasks only within individual projects.
Start using a dashboard
If you are using dashboards for the first time in Swit, New dashboard, the default dashboard screen, will be displayed. Click Create dashboard to create a new dashboard.
Browse dashboards
When you click + Add dashboard, then click Browse dashboards, you can browse public dashboards created by other members and participate if necessary.
Reselect projects in a dashboard
When you want to add new projects to your dashboard or delete some projects from your dashboard, you can reselect the projects to include as follows:
- Click on the checkbox icon at the top right of the dashboard page. The number next to the icon is the number of projects in the dashboard.
- Click Reselect projects.
- Select the projects you want to delete or select the projects you want to add to the dashboard using the filter and search features.
Duplicate a dashboard
Dashboards can be duplicated including the filters and all other options. You can duplicate a dashboard by clicking on the dashboard name, and clicking Duplicate.
Invite members to a dashboard
To invite new members to a dashboard, click on ( )at the top right of the dashboard page, and click Add members. You can find and select members to invite from the list or search for members, teams, and groups.
Leave a dashboard
To leave a dashboard you joined, click on the dashboard name, and click Leave dashboard.
Manage dashboard information and members
In the Dashboard info tab, you can view and edit the dashboard's name and description. In the Dashboard members tab, you can see the list of members participating in the dashboard, and transfer the host role to a member or remove members from the dashboard.
Dashboard permissions
When you browse dashboards, the list of public dashboards appear in the result. All workspace members can join the dashboards in the list and view them. When a public dashboard includes charts on private projects, those who joined the dashboard can also view the charts on private projects. Note that a private dashboard can only be accessed by the members invited by the dashboard host.
Copy a dashboard URL
If you need to share the dashboard, you can copy the link and use it anywhere. Clicking Copy link in the upper right corner of the dashboard will copy the dashboard link.
Delete a dashboard
In the Delete dashboard tab, you can delete the dashboard. Deleting the dashboard will delete all the charts contained in the dashboard permanently, but the projects and tasks on which the charts are based will not be deleted.
Single dashboard
The single dashboard consolidates scattered information within individual tasks of a single project. You don't need to filter individual projects separately through the dashboard section; there's a Dashboard tab within each project.
Various chart types
The charts in the dashboard are automatically filled in at creation. In addition to the default configuration for the charts, you can create various types of charts that suit your workflow as follows:
- Stacked bar: Shows the cumulative total of tasks by assignee, status, priority, tag, and project.
- Donut / pie: Shows the proportion of tasks by assignee, status, priority, tag, and project.
- Bar: Shows the number of tasks by assignee, status, priority, tag, and project.
- Lollipop: Shows the number of tasks by assignee, status, priority, tag, and project at a glance.
- Battery: Shows the percentage of tasks by assignee, status, priority, tag, and project.
- Line graph: Shows the number of tasks over time based on the time units selected for the X-axis.
- Number: Shows the total number of tasks in the selected projects.
Add a new chart
Click + New chart at the left-hand corner of the dashboard page to add a new chart to the dashboard. Enter a chart name and select a chart type and options to create a new chart to your dashboard.
Edit a chart
You can edit the chart at any time. Click on ( ) on the right side of the chart and click Edit chart. You can edit the chart name, type, filter, and other information you want.
Change the chart location
When you place the mouse cursor over the chart area, a drag-and-drop icon ( )appears in the upper left corner of the chart. By clicking on this icon and dragging and dropping to your desired location, the location will change immediately.
NOTE
Depending on the type of chart, the size it occupies in a section may vary. Therefore, it might be challenging to change its position as you wish. You can only change the positions between charts of the same type.
Copy a chart link
When you want to share an individual chart, you can copy the chart link. Enlarge the chart you want to copy by clicking on the  icon, and click
  to copy the chart link.
Delete a chart
If you no longer need a chart in your dashboard, you can delete it by clicking on the See more () icon on the right side of the chart, and click Delete chart.